ENG vs WI Pitch Report 1st Test: Lord’s Cricket Ground Records, Players Stats, Average Score and More
Published on: Jul 9, 2024 2:00 pm IST|Updated on: Jul 10, 2024 2:20 pm IST
England are all set to host West Indies in the 1st Test match of the West Indies Tour of England 2024 on 10th July (3:30 pm IST) at Lord’s in London.
Lord’s Cricket Ground Pitch Report
Lord’s Cricket Ground is known for its surface having a slope. Pace bowlers will get tremendous support as there will be natural swings throughout the match. Batters will find difficulties against the old balls as reverse swings will be there. The match is expected to get a result in 3 days.
Is Lord’s Cricket Ground a batting or a bowling pitch?
The recent Test matches played here, have revealed a Balanced wicket.
Last Test Result at the Venue
- (28 Jun – 2 July 2023):
Australia: 416 (Pacers – 8w, Spinners – 2w) & 279 (Pacers – 10w, Spinners – 0w)
England: 325 (Pacers – 7w, Spinners – 3w) & 327 (Pacers – 10w, Spinners – 0w)
Australia won by 43 runs.
- (1 Jun – 3 June 2023):
Ireland: 172 (Pacers – 7w, Spinners – 3w) & 362 (Pacers – 7w, Spinners – 2w)
England: 524/4 d (Pacers – 2w, Spinners – 2w) & 12/0 (Pacers – 0w, Spinners – 0w)
England won by 10 wickets.
ENG Test record in Lord’s Cricket Ground
ENG have played 146 Test matches at this venue and won 58, lost 36 & drew 52 matches.
ENG’s Highest Total: 653/4d vs India in 1990
ENG’s Lowest Total: 53/10 vs Australia in 1888
WI Test record in Lord’s Cricket Ground
WI have played 21 Test matches at this venue and won 4 & lost 10, drew 7 matches.
WI’s Highest Total: 652/8d vs England in 1973

WI’s Lowest Total: 54/10 vs England in 2000
Related ENG vs WI Dream11 Prediction 1st Test Match
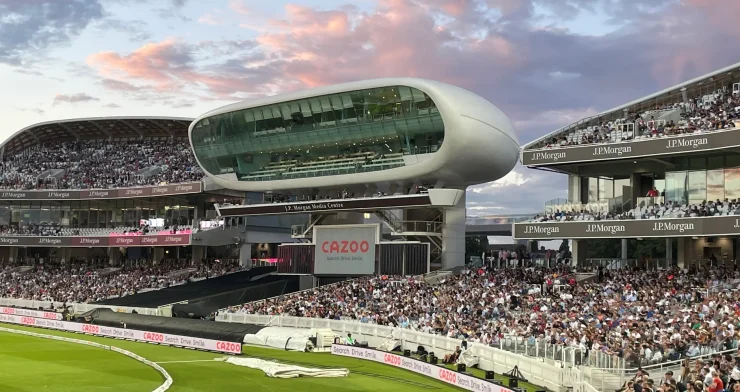
Lord’s Cricket Ground Ground Info
Seating Capacity: 30000
Number of matches hosted: 146 Tests, 69 ODIs & 10 T20Is
Lord’s Cricket Ground T20I Stats and Records
Total Matches Played: 146
Home Team (ENG) Won: 58
Visiting Team Won: 36
Neutral Side Won: 0
Draw: 52
Tie/ No Result: 0
1st Innings Average: 303
2nd Innings Average: 296
3rd Innings Average: 279
4th Innings Average: 165
Matches Won Batting 1st: 52
Matches Won Batting 2nd: 42
Highest Team Total: 729/6d by Australia vs England in 1930
Lowest Team Total: 38/10 by Ireland vs England in 2019
Highest Run-chase: 344/1 (19.3 overs) by West Indies vs England in 1984
Highest Individual Score: Graham Gooch (ENG) – 333 vs India in 1990
Best Bowling Figures in an innings: Ian Botham (ENG) – 8 for 34 in vs Pakistan in 1978
Most Runs: Graham Gooch (ENG) – 2015 runs in 39 innings
Most Wickets: James Anderson (ENG) – 119 wickets in 54 innings
ENG Players Stats at Lord’s Cricket Ground in Test
- Joe Root: 1708 runs in 37 innings & 9 wickets in 16 innings
- Ben Stokes: 839 runs in 19 innings & 22 wickets in 17 innings
- Ollie Pope: 415 runs in 10 innings
- Ben Duckett: 363 runs in 4 innings
- Chris Woakes: 306 runs in 8 innings & 27 wickets in 10 innings
- Zak Crawley: 197 runs in 10 innings
- James Anderson: 119 wickets in 54 innings
- Matthew Potts: 12 wickets in 5 innings
ODI:
- Harry Brook: 10 runs in 1 match
Blast:
- Jamie Smith: 37 runs in 5 matches
- Gus Atkinson: 7 wickets in 6 matches
WI Players Stats at Lord’s Cricket Ground in Test
- Jason Holder: 32 runs & 4 wickets in 2 innings
- Kraigg Braithwaite: 14 runs in 2 innings
most runs at Lord’s Cricket Ground in Test among active batters
- Joe Root (ENG): 1708 runs in 37 innings
- Ben Stokes (ENG): 839 runs in 19 innings
- Steve Smith (AUS) – 525 runs in 9 innings
most wickets at Lord’s Cricket Ground in Test among active bowlers
- James Anderson (ENG): 119 wickets in 54 innings
- Chris Woakes(ENG): 27 wickets in 10 innings
- Tim Southee (NZ): 24 wickets in 9 innings
Photo Gallery